This article shares how to use Gcov and LCOV to measure code coverage for C/C++ projects. If you want to know how Gcov works, or you need to measure code coverage for C/C++ projects later, I hope this article is useful to you.
Updated in October 2026: this article was written in 2021 against GCC 4.8.5 and LCOV 1.14, and the example repository has changed several times since. The environment, commands and outputs below now match the current
masterbranch of gcov-example. I also corrected my original misunderstanding of what the.gcovfiles are for, and added the pitfalls that actually bite on legacy projects.
Problems#
The problem I’m having: A C/C++ project from decades ago has no unit tests, only regression tests, but you want to know what code is tested by regression tests? Which code is untested? What is the code coverage? Where do I need to improve automated test cases in the future?
Can code coverage be measured without unit tests? Yes.
Code coverage tools for C/C++#
There are some tools on the market that can measure the code coverage of black-box testing, such as Squish Coco, Bullseye, etc. Their principle is to insert instrumentation when build product.
I’ve done some research on Squish Coco, because of some unresolved compilation issues that I didn’t buy a license for this expensive tool.
When I investigated code coverage again, I found out that GCC has a built-in code coverage tool called Gcov.
Prerequisites#
For those who want to use Gcov, to illustrate how it works, I have prepared a sample program that
requires GCC, LCOV and gcovr
to be installed before running the program. On Debian/Ubuntu, make deps in the repository installs them
(lcov via apt, gcovr via pipx).
If you don’t have an environment or don’t want to install it, you can check out this example repository
Note: The source code is under the master branch. CI pushes the generated reports to the coverage branch
after every build, and they are online: LCOV report
and gcovr report.
# The environment used in this article, which is also what the repository's CI runs: Ubuntu 24.04
$ gcc --version
gcc (Ubuntu 13.3.0-6ubuntu2~24.04.1) 13.3.0

$ lcov --version
lcov: LCOV version 2.0-1

$ gcovr --version
gcovr 8.7
Ubuntu 24.04 ships lcov 2.0; at the time of this update the latest lcov is 2.6 and the latest gcovr is 8.7. If, like me, you are coming from lcov 1.x, three things changed in 2.x:
- 2.x checks the data for consistency and, by default, exits with an ERROR when something is off, where 1.x printed a WARNING and carried on. To get past it you have to say
--ignore-errors <type>explicitly; there is a real example in the notes below. - 2.x depends on more Perl modules. When installing from source, install the modules its README lists.
- The branch coverage switch is now
--rc branch_coverage=1. The 1.x namelcov_branch_coveragestill works but is deprecated.
How Gcov works#
Gcov workflow diagram
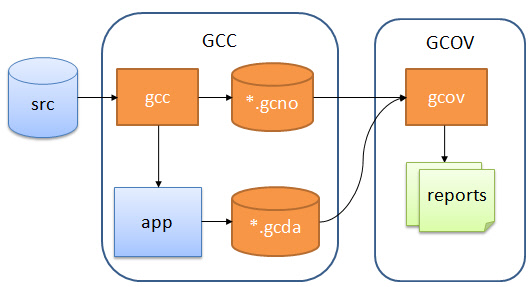
There are three main steps:
- Adding special compilation options to the GCC compilation to generate the executable, and
*.gcno. - Running (testing) the generated executable, which generates the
*.gcdadata file. - With
*.gcnoand*.gcda, lcov or gcovr callgcovinternally to read them and generate the code coverage report.gcovcan also be run on its own to produce.gcovtext files with per-line execution counts.
Here’s how each of these steps is done exactly.
1. Compile#
The first step is to compile. The parameters and files used for compilation are already written in the makefile,
so make build is all it takes (a bare make with no target only prints the help).
make buildClick to see the output of the make build command
$ make build
gcc -fPIC -fprofile-arcs -ftest-coverage -c -Wall -Werror main.c -o main.o
gcc -fPIC -fprofile-arcs -ftest-coverage -c -Wall -Werror foo.c -o foo.o
gcc -fPIC -fprofile-arcs -ftest-coverage -c -Wall -Werror test.c -o test.o
gcc -fPIC -fprofile-arcs -ftest-coverage -c -Wall -Werror trigger.c -o trigger.o
gcc -fPIC -fprofile-arcs -ftest-coverage -o main main.o foo.o test.o trigger.o
As you can see from the output, this program is compiled with two compile options -fprofile-arcs and -ftest-coverage.
The more common spelling today is a single --coverage, which is equivalent to those two options when compiling
and to -lgcov when linking. The example now has four source files, main.c, foo.c, test.c and trigger.c,
and main calls foo(1), foo(2), test_zero() and trigger_action() in turn.
After successful compilation, not only the main and .o files are generated, but also four .gcno files.
The
.gcnorecord file is generated after adding the GCC compile option-ftest-coverage, which contains information for reconstructing the base block map and assigning source line numbers to blocks during the compilation process.
2. Running the executable#
After compilation, the executable main is generated, which is run (tested) as follows
./mainClick to see the output when running main
$ ./main
Start calling foo() ...
when num is equal to 1...
when num is equal to 2...
test 0
TRIGGER is OFF: running default logic...
When main is run, the results are recorded in the .gcda data file, and if you look in the current directory,
you can see that four .gcda files have been generated, one per source file.
$ ls
LICENSE  README.md  foo.c  foo.gcda  foo.gcno  foo.h  foo.o  img  main  main.c  main.gcda  main.gcno  main.o  makefile  test.c  test.gcda  test.gcno  test.h  test.o  trigger.c  trigger.gcda  trigger.gcno  trigger.h  trigger.o
.gcdarecord data files are generated because the program is compiled with the-fprofile-arcsoption introduced. It contains arc transition counts, value distribution counts, and some summary information.
For a project that only has regression tests, two things about .gcda matter more than the commands:
.gcdais only written when the process exits normally. libgcov writes the counters from a destructor that runs at exit, so a process that is killed withkill -9, crashes, or leaves through_exit()writes nothing. I tried it: a program that exits via_exit(0)leaves no.gcdabehind; call__gcov_dump()before_exit(0)and the file appears. A long-running service has to call__gcov_dump()itself at a suitable point (__gcov_reset()clears the counters to start over), otherwise a whole regression run leaves nothing behind.- Counts accumulate. Run the same executable several times and the counters in
.gcdaadd up rather than being overwritten: after runningmaintwice, thefoo(1);line inmain.c.gcovshows a count of 2. That is exactly what you want for regression tests: run the whole suite, then capture once to get the total coverage. Conversely, delete the.gcdafiles to start counting from zero.
3. Generating reports#
make lcov-report    # writes lcov-report/index.html
# or
make gcovr-report   # writes gcovr-report/coverage.html
Click to see the output of make lcov-report
$ make lcov-report
gcov main.c foo.c test.c trigger.c
File 'main.c'
Lines executed:100.00% of 7
Creating 'main.c.gcov'

File 'foo.c'
Lines executed:85.71% of 7
Creating 'foo.c.gcov'

File 'test.c'
Lines executed:100.00% of 1
Creating 'test.c.gcov'

File 'trigger.c'
Lines executed:100.00% of 3
Creating 'trigger.c.gcov'

Lines executed:94.44% of 18
mkdir -p lcov-report
lcov --capture --directory . --no-recursion --output-file lcov-report/coverage.info
Capturing coverage data from .
geninfo cmd: '/usr/bin/geninfo . --output-filename lcov-report/coverage.info --no-recursion --memory 0'
Found gcov version: 13.3.0
Using intermediate gcov format
Writing temporary data to /tmp/geninfo_datErwK
Scanning . for .gcda files ...
Found 4 data files in .
Processing ./foo.gcda
Processing ./test.gcda
Processing ./trigger.gcda
Processing ./main.gcda
Finished .info-file creation
genhtml lcov-report/coverage.info --output-directory lcov-report
Found 4 entries.
Found common filename prefix "/"
Generating output.
Processing file /work/test.c
  lines=1 hit=1 functions=1 hit=1
Processing file /work/trigger.c
  lines=3 hit=3 functions=1 hit=1
Processing file /work/foo.c
  lines=7 hit=6 functions=1 hit=1
Processing file /work/main.c
  lines=7 hit=7 functions=1 hit=1
Overall coverage rate:
  lines......: 94.4% (17 of 18 lines)
  functions......: 100.0% (4 of 4 functions)
Executing make lcov-report to generate an HTML report actually performs two main steps behind this command.
Run
gcov main.c foo.c test.c trigger.c, which writes one.gcovtext file per source file with the execution count of every line.Run
lcov --captureto collect the data from.gcnoand.gcdaintocoverage.info, thengenhtmlto turn it into an HTML report.
Here I have to correct what this article originally said. I wrote that LCOV generates the report “with the .gcov files”,
and that is wrong: step 2 does not read the .gcov files from step 1 at all. lcov’s geninfo runs gcov itself in a
temporary directory to read .gcno and .gcda (recent versions go through gcov’s JSON intermediate format, which is the
“Using intermediate gcov format” line in the output), and gcovr does the same. Delete every .gcov file and run
lcov --capture again, and the report still comes out. Running gcov by hand is only for reading the per-line
annotation yourself, for example foo.c.gcov:
        -:    0:Source:foo.c
        -:    1:#include <stdio.h>
        -:    2:
        2:    3:void foo(int num) {
        2:    4:  if (num == 1) {
        1:    5:    printf("when num is equal to 1...\n");
        1:    6:  } else if (num == 2) {
        1:    7:    printf("when num is equal to 2...\n");
        -:    8:  } else {
    #####:    9:    printf("when num is equal to %d...\n", num);
        -:   10:  }
        2:   11:}
The first column is the execution count: ##### marks a line that was never executed, and - a line with no executable code.
The steps to generate the HTML result report are as follows.
# 1. Generate the coverage.info data file
#    --no-recursion keeps the data the multi-configuration demo below writes under build/ out of this report
lcov --capture --directory . --no-recursion --output-file lcov-report/coverage.info
# 2. Generate a report from this data file
genhtml lcov-report/coverage.info --output-directory lcov-report
With gcovr it is a single command, and it calls gcov itself:
gcovr --root . --exclude-directories build --html --html-details --output gcovr-report/coverage.htmlDelete all generated files#
All the generated files can be removed by executing make clean command.
Click to see the output of the make clean command
$ make clean
rm -rf main *.out *.o *.so *.gcno *.gcda *.gcov build \
      lcov-report gcovr-report merged-report trigger-report
Code coverage report#
The screenshots below are from LCOV 1.14 in 2021, when the example only had main.c and foo.c.
The current report is online: LCOV report.
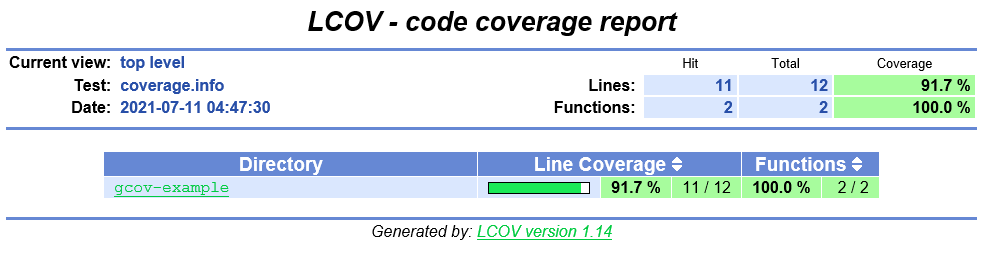
The home page is displayed in a directory structure
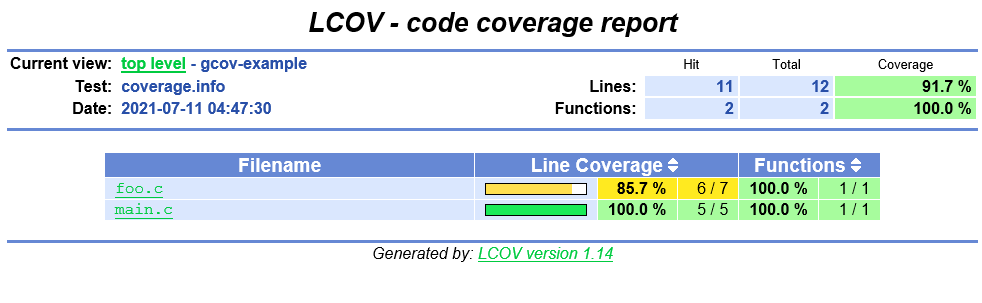
After entering the directory, the source files in that directory are displayed
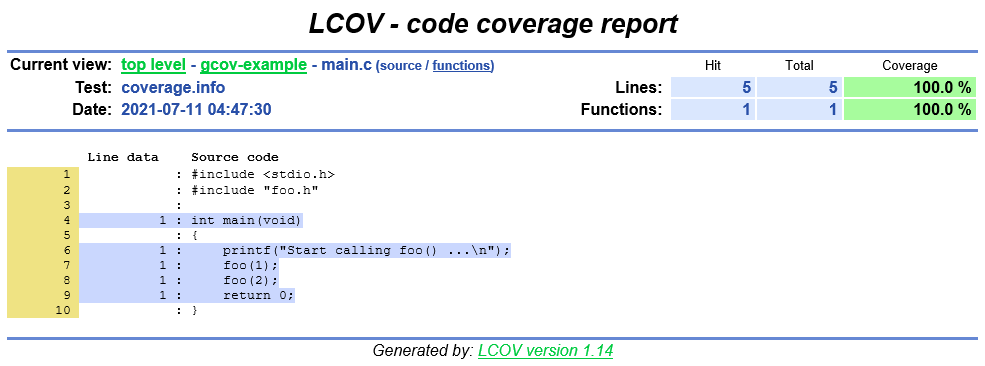
Blue marks the statements that were covered
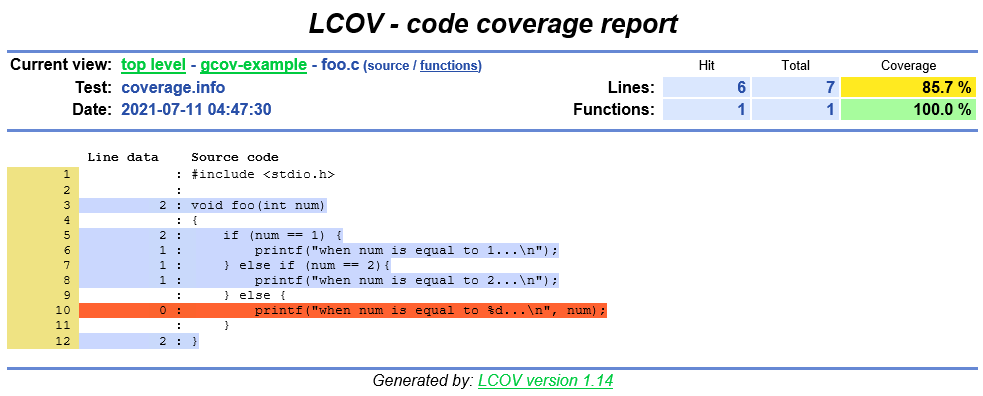
Red marks the statements that were not covered
LCOV supports statement, function, and branch coverage metrics.
Side notes:
There is another tool for generating HTML reports called gcovr, developed in Python;
make gcovr-report above produces its report. When this article was first written, gcovr could only list files by path,
while LCOV showed them in a directory structure that mirrors the code, so I preferred LCOV at the time. Since gcovr 6.0
there is --html-nested for a per-directory report, and 8.7 switched the default theme to a GitHub-style one. Both can
do a directory view now; pick whichever your team is used to. The repository provides both:
LCOV report,
gcovr report.
Advanced: merging coverage from multiple build configurations#
In real projects the same source is often compiled into several configurations with different macros (feature flags, platform switches). A single build only sees the code it compiled in; the other branch is never compiled, so it never shows up in the report, and a 100% figure is lying to you.
trigger.c in the repository is such an example, with an #ifdef TRIGGER_ON / #else block that prints one line in each branch:
void trigger_action(void) {
#ifdef TRIGGER_ON
  printf("TRIGGER is ON: running extra logic...\n");
#else
  printf("TRIGGER is OFF: running default logic...\n");
#endif
}
make coverage-merged builds the two configurations into build/config1 (with -DTRIGGER_ON) and build/config2 (default),
runs each once, then merges the two .info files into one report with lcov --add-tracefile:
lcov --capture --directory build/config1 --output-file build/config1.info
lcov --capture --directory build/config2 --output-file build/config2.info
lcov --add-tracefile build/config1.info --add-tracefile build/config2.info --output-file build/merged.info
genhtml build/merged.info --output-directory merged-report| Build | trigger.c lines hit |
|---|---|
build/config1 (-DTRIGGER_ON) | 3 of 3 |
build/config2 (default) | 3 of 3 |
| merged | 4 of 4 |
Each configuration alone reports 100%; only the merged report sees both branches.
Each configuration must be built into its own directory. GCC stamps every .gcno with the compile time,
so if two configurations share a directory, the second build overwrites the .gcno files, and the .gcda written by the
first binary no longer matches them. gcov reports stamp mismatch with notes file, and lcov 2.x exits with ERROR: GCOV failed.
To look at a single file only, use lcov --extract to pull it out of the full .info; make coverage-filter in the
repository demonstrates this for trigger.c. Online: merged report,
trigger.c only.
Notes#
Back to the scenario from the beginning: a legacy project with nothing but black-box regression tests. Beyond the timing
of the .gcda write discussed above, there are a few more pitfalls I did not write down in 2021 that are easy to hit on such a project.
Build for coverage with
-O0 -g. Optimisation merges or removes lines and line coverage becomes distorted. For the samefoo.c, gcov reportsLines executed:85.71% of 7at-O0and100.00% of 4at-O2; the untestedelsebranch simply disappears from the report.When the test machine is not the build machine, use
GCOV_PREFIXandGCOV_PREFIX_STRIP. The path.gcdais written to is an absolute path baked in at compile time, and if that directory does not exist on the test machine nothing gets written. For example, if the object file was built as/user/build/foo.o, settingGCOV_PREFIX=/target/runandGCOV_PREFIX_STRIP=1on the test machine makes the program write/target/run/build/foo.gcda; copy the.gcdafiles back to the build machine to generate the report. See Cross-profiling in the GCC manual.gcovmust be the same version as thegccthat did the build. Compile with gcc-12 and read with gcov 13, and gcov complainsmain.gcno:version 'B24*', prefer 'B33*', while lcov 2.x stops with an error:geninfo: ERROR: Incompatible GCC/GCOV version found while processing /work/foo.gcda: Your test was built with 'B24*'. You are trying to capture with gcov tool '/usr/bin/gcov' which is version 'B33*'. (use "geninfo --ignore-errors version ..." to bypass this error)Do not reach for
--ignore-errorshere; pass--gcov-tool gcov-12so lcov uses the matching gcov.On macOS,
gccis actually Apple clang. Itsgcovisllvm-cov gcov. Compiling with--coverage, running./mainandgcov main.call work as before, but lcov 2.x needs--gcov-tool llvm-cov --gcov-tool gcovto find it (1.x needed a wrapper script). clang and GCC also do not count “lines” the same way: for the samefoo.c, GCC 13 reports85.71% of 7and Apple clang 21 reports87.50% of 8. Do not compare coverage figures across compilers.
Further reading#
- About Code Coverage
- Using Gcov in the Linux kernel: https://docs.kernel.org/dev-tools/gcov.html
- Environment variables for when the build and test environments differ: https://gcc.gnu.org/onlinedocs/gcc/Cross-profiling.html
- Beyond coverage, for formatting and static checks of C/C++ projects in CI see cpp-linter-action; the gcov-example repository uses it for its own PR checks.